EasyMPI
A light-weight profiler tool for parallel applications built on top of Contech. This repo should be a fork to the original Contech Repo. A link in README links to that repo.
This project is maintained by alphalzh
EasyProf: An easy-to-use parallel application profiling toolkit based on Contech
We implemented EasyProf (formerly named EasyMPI), a light-weight profiler tool for parallel applications built on top of frameworks like pthread, cilk and OpenMP. This project is based on Contech, an instrumentation framework for parallel computing developed by B. P. Railing et al.
Introduction
Performance is always one of the most important aspects to consider in terms of parallel application design. However, it’s often non-trivial to measure a parallel application’s performance and figure out the bottlenecks. Therefore, we decide to build a profiling tool that can help programmers learn more about their parallel applications’ performance.
We implemented our profiling tool on top of Contech, an instrumentation framework which is capable of collecting traces from parallel applications and generating task graphs from the collected trace. Such task graphs can then be processed by various “backends” to yield useful profiling results. EasyProf can be regarded as a powerful backend for Contech such that given a task graph file generated by running a Contech-instrumented executable, it can provide detailed statistics and useful information such as visualization of the task graph, work imbalance across multiple execution contexts, total time spent on synchronization, etc. to the programmer.
How to build EasyProf
Please ensure C++ 11 is supported by your compiler. If you use g++, it requires a minimum version of 4.8. Enter the directory contech/backends/EasyProf and just hit make to do the work!
How to use EasyProf
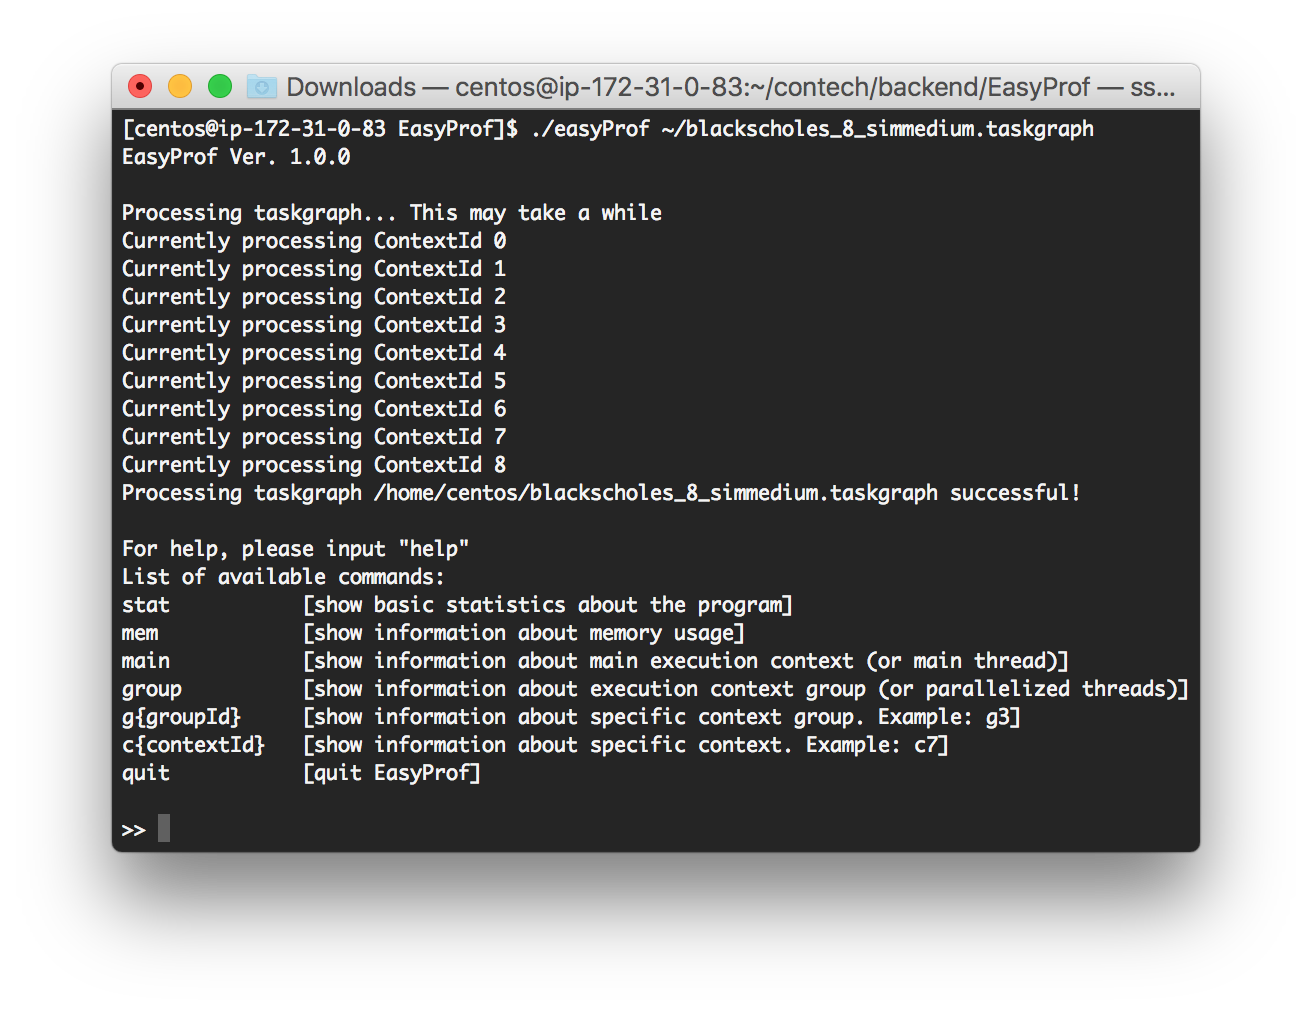
After successfully compile the code, run ./easyProf taskGraphInputFile to run the profiler, and ./easyViz taskGraphInputFile to run the visualizer. You can play with the task graph files we included in the /taskgraphs directory!
You may have to wait a while for the profiler to work. It will display information on screen about the current processing progress. After it finished processing the task graph, you will be prompted to input command.
Available commands includes:
- stat (show basic statistics about the program)
- mem [show information about memory usage]
- main [show information about main execution context (or main thread)]
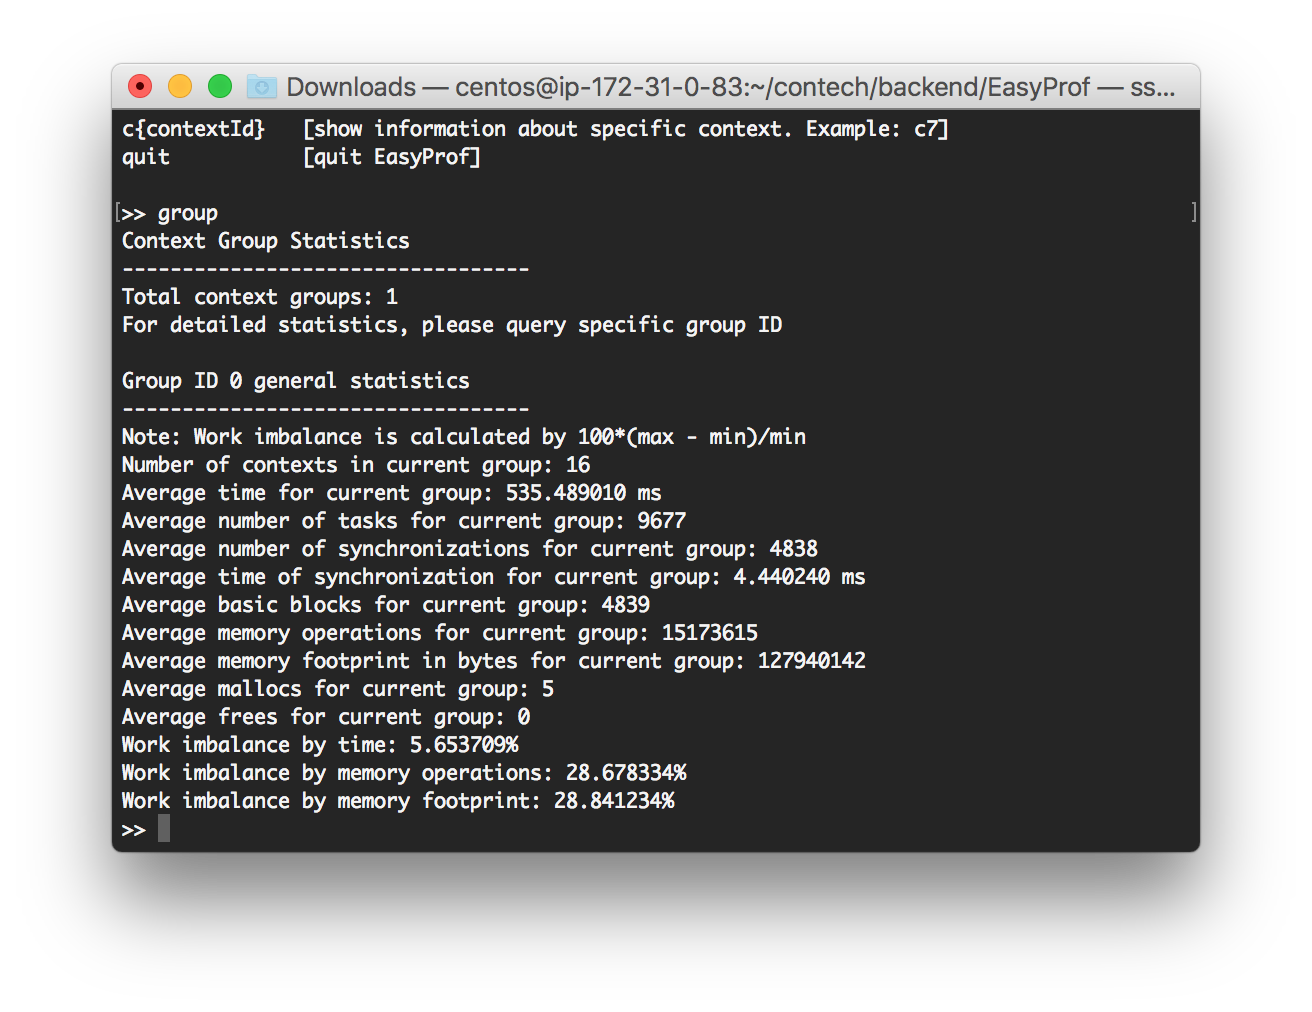
- group [show information about execution context group (or parallelized threads)]
- g{groupId} [show information about specific context group. Example: g3]
- c{contextId} [show information about specific context. Example: c7]
- quit [quit EasyProf]
For detailed information about the profiler, e.g. what statistics it can generate, please refer to the final report linked below.
Demo
The project will be demoed at the poster session on December 12th. An MPI program will be profiled by the profiler, and we will show how it can help the programmers optimize their code based on the profiling result.
Screenshots of actual runs:
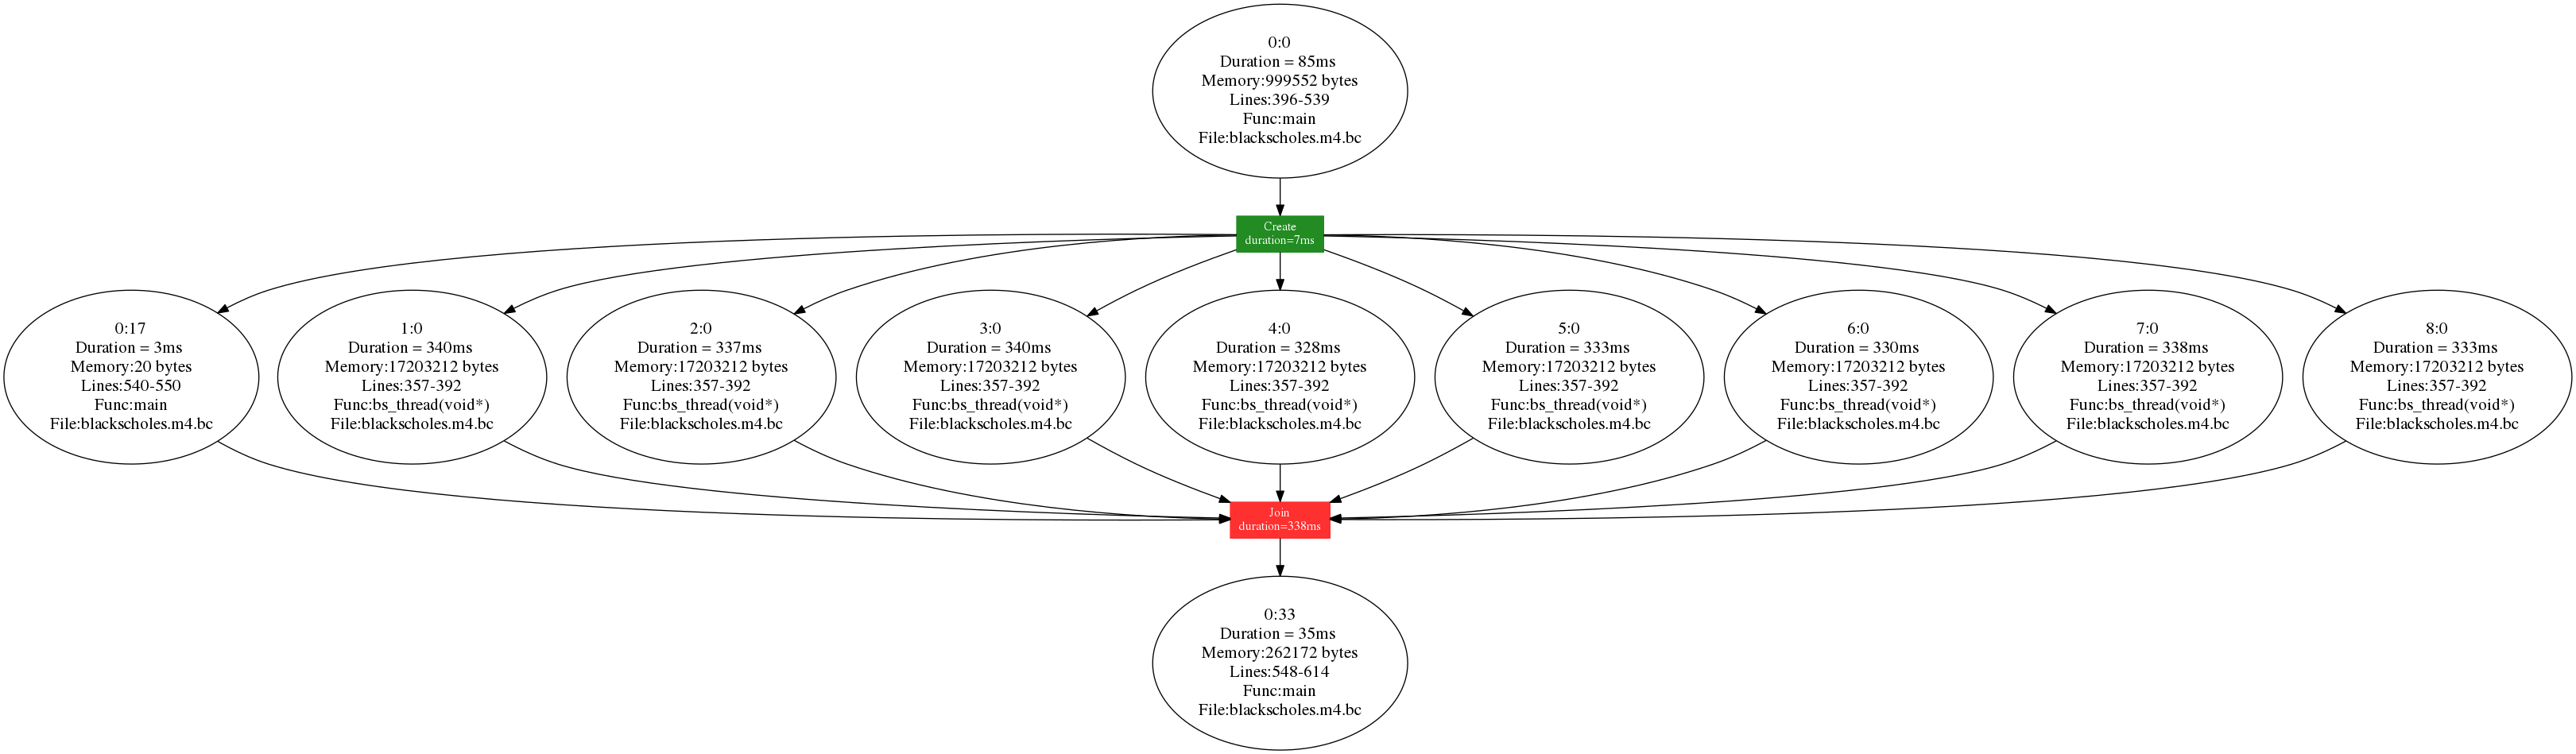
 Generated task graph:
Proposal
Please click here for the project proposal.
Checkpoint Report
Please click here for the project checkpoint report.
Final Report
Please click here for the project’s final report.